
Tutorial: Debugging Code Not Launched by the IDE

So far we've been debugging code launched from inside of Wing. Wing can also debug processes that are running within a web framework, as scripts in a larger application, or that get launched from the command line. These are cases where a debug process cannot be launched from the IDE, so another method is needed to initiate debug.
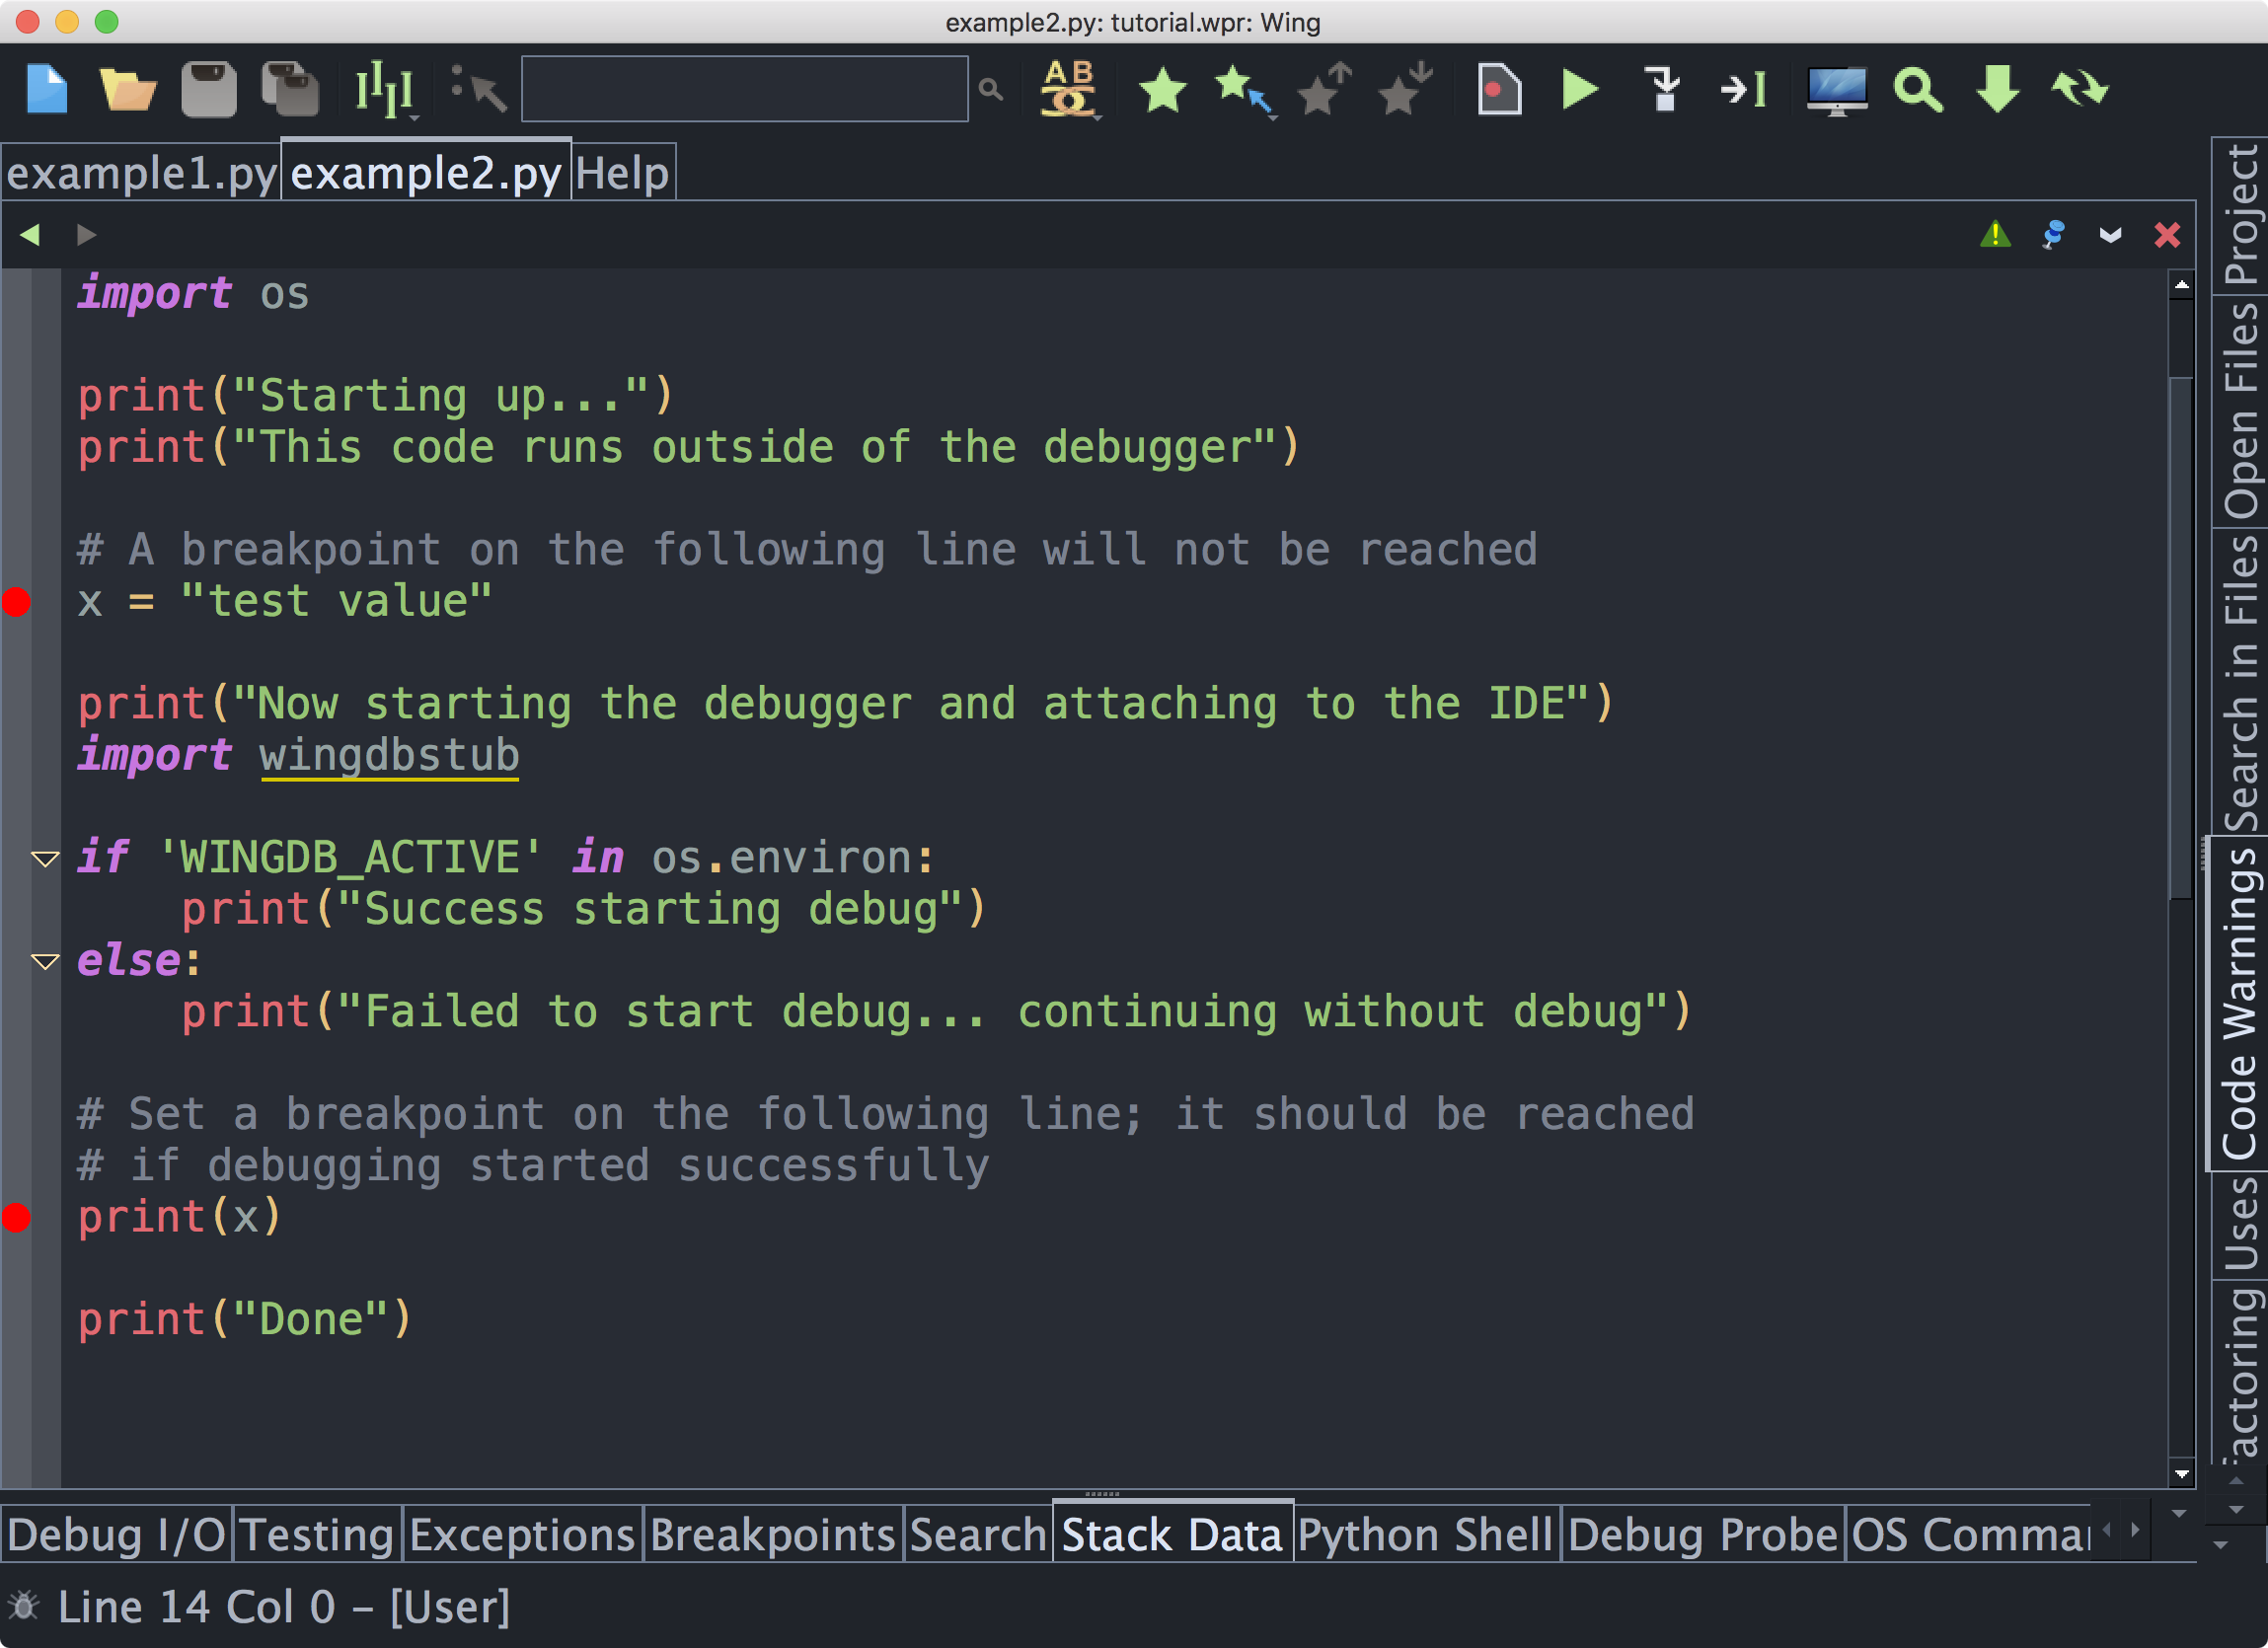
Let's try this now with example2.py in your tutorial directory. First, copy wingdbstub.py out of the Install Directory listed in Wing's About box. Place wingdbstub.py in the same directory as example2.py. Next, click on the bug icon in the lower left of Wing's main window and select Accept Debug Connections. Then set a breakpoint on lines 10 and 22 of example2.py:
If you are working on macOS, or used the Windows zip or Linux tar installers for Wing, you will need to edit wingdbstub.py in order to set WINGHOME to the full path to the Install Directory you copied it from. This is done automatically by the other installers. If you are using one of those you can skip this step.
Now we're ready to debug example2.py when it is launched from outside of the IDE. To launch it, use the DOS Command prompt on Windows, a bash or similar command prompt on Linux, or Terminal or an xterm on macOS to type:
python example2.py
You may need to specify the full path to python if it is not on your path.
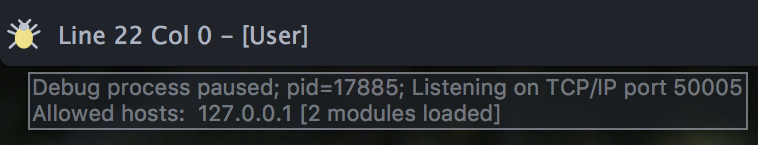
This should start up the code, print some messages, connect to the IDE, and stop on the breakpoint on line 22. Notice that the breakpoint on line 10 was not reached because debugging had not yet been initiated at that point. Read through the code and the messages printed to better understand what is happening. You can verify that the debugger attached by looking at the color of the bug icon in the lower left of the IDE window, and by hovering the mouse over it:
Once you are stopped at a breakpoint or exception in externally launched code, the debugger works just as it would had you launched the debug process from the IDE. The only difference is that the environment is set up by the process itself and the settings specified in Project Properties and File Properties are not used.
When you continue the debugger from the toolbar or Debug menu, the program should print the value of x and exit.
This is a very simple example to illustrate how externally launched code can be debugged. The import of wingdbstub can also be placed in functions or methods, and there is a debugging API that provides control over starting and stopping debugging.
See Debugging Externally Launched Code for details, and the How-Tos for help setting this up with specific frameworks and applications.
Remote Debugging
Using the same mechanism, it is also possible to debug Python code launched on another machine, as documented in Debugging Externally Launched Remote Code.
This is part of Wing Pro's ability to work with a remote host through a secure SSH tunnel. This supports all of Wing Pro's features, so you can edit, search, debug, test, and manage remote code in the same way as if it were stored locally, and you can run the Python Shell and OS Commands on the remote host.
This is the preferred way to work with code on a remote host, although you may still need to use wingdbstub to initiate debug if your code cannot be launched from the IDE.
See Remote Hosts for more information.